5G Buffer State – Matrix Neon Edge
Source Code Locked
Get the appropriate Subscription to unlock all copy-paste ready components instantly.
Description
Let us look at the 5G Buffer State Matrix Neon Edge component. This Basic UI asset offers a modular card system specifically engineered for the telecommunications sector. We built this entirely from scratch to handle network latency data without the usual framework bloat. You get a sterile DOM structure that integrates cleanly into your existing network monitoring architecture.
Telecom platforms process heavy streams of live bandwidth data and require absolute reliability during diagnostic checks. Massive client side payloads completely ruin performance metrics when immediate visual feedback is needed for active 5G node states. This component solves that bottleneck directly. By strictly avoiding external libraries like Tailwind, Bootstrap, or GSAP, it keeps your bundle size minimal. This ensures rapid rendering for network engineers and system administrators who need to monitor live buffer states on busy infrastructure networks.
Technical Architecture & Performance
-
Zero dependency codebase: Built strictly with pure HTML, CSS, and Vanilla JavaScript to keep your front end stack incredibly light.
-
Guaranteed performance metrics: Optimized to help your telecom software maintain 90 plus PageSpeed scores and pass Core Web Vitals easily.
-
Safely scoped CSS: All styling is strictly scoped to prevent any class name collisions when you drop these cards into a massive monolithic repository.
-
Sterile DOM markup: Features clean HTML with absolutely no unnecessary wrappers or deep nesting trees to parse.
Design & Aesthetic Impact
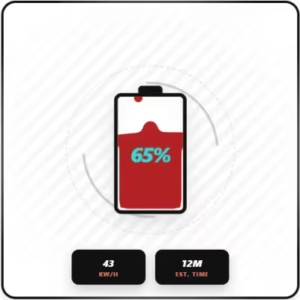
The visual direction pairs bright Neon Matrix tones with a sharp edge layout to establish a highly technical and developer focused environment. This high contrast and highly readable aesthetic ensures visual clarity for users analyzing complex bandwidth metrics and dense routing logs. For the interaction layer, we implemented custom Hitam Keabuan animations. These smooth black and grayish visual transitions provide clear feedback for active network buffering and latency spikes without requiring heavy javascript animation scripts. The final result is a clean user interface that looks premium and functions perfectly for strict enterprise telecommunications environments.
Enterprise Use Cases
-
Cellular node monitoring dashboards: Display active buffer states and latency metrics using the card grid so network engineers can monitor cell tower health quickly.
-
ISP diagnostic portals: Build a fast rendering troubleshooting page where support teams can organize and review massive datasets of customer bandwidth usage within a lightweight interface.
-
Telecom infrastructure panels: Create a responsive control layout for system administrators to track active routing protocols and packet loss across multiple regional fiber networks.
Highlights & Benefits
Drop the code straight into your project without configuration.
Built strictly with pure CSS & Vanilla JS for maximum speed.
Constructed with strict adherence to WCAG accessibility standards for perfect contrast and screen-reader support.
Utilizes a highly optimized, clean DOM architecture ensuring lightning-fast render and maximum PageSpeed scores.

5G Buffer State – Matrix Neon Edge
Description
Let us look at the 5G Buffer State Matrix Neon Edge component. This Basic UI asset offers a modular card system specifically engineered for the telecommunications sector. We built this entirely from scratch to handle network latency data without the usual framework bloat. You get a sterile DOM structure that integrates cleanly into your existing network monitoring architecture.
Telecom platforms process heavy streams of live bandwidth data and require absolute reliability during diagnostic checks. Massive client side payloads completely ruin performance metrics when immediate visual feedback is needed for active 5G node states. This component solves that bottleneck directly. By strictly avoiding external libraries like Tailwind, Bootstrap, or GSAP, it keeps your bundle size minimal. This ensures rapid rendering for network engineers and system administrators who need to monitor live buffer states on busy infrastructure networks.
Technical Architecture & Performance
-
Zero dependency codebase: Built strictly with pure HTML, CSS, and Vanilla JavaScript to keep your front end stack incredibly light.
-
Guaranteed performance metrics: Optimized to help your telecom software maintain 90 plus PageSpeed scores and pass Core Web Vitals easily.
-
Safely scoped CSS: All styling is strictly scoped to prevent any class name collisions when you drop these cards into a massive monolithic repository.
-
Sterile DOM markup: Features clean HTML with absolutely no unnecessary wrappers or deep nesting trees to parse.
Design & Aesthetic Impact
The visual direction pairs bright Neon Matrix tones with a sharp edge layout to establish a highly technical and developer focused environment. This high contrast and highly readable aesthetic ensures visual clarity for users analyzing complex bandwidth metrics and dense routing logs. For the interaction layer, we implemented custom Hitam Keabuan animations. These smooth black and grayish visual transitions provide clear feedback for active network buffering and latency spikes without requiring heavy javascript animation scripts. The final result is a clean user interface that looks premium and functions perfectly for strict enterprise telecommunications environments.
Enterprise Use Cases
-
Cellular node monitoring dashboards: Display active buffer states and latency metrics using the card grid so network engineers can monitor cell tower health quickly.
-
ISP diagnostic portals: Build a fast rendering troubleshooting page where support teams can organize and review massive datasets of customer bandwidth usage within a lightweight interface.
-
Telecom infrastructure panels: Create a responsive control layout for system administrators to track active routing protocols and packet loss across multiple regional fiber networks.