CyberSec Server Vitals – Crimson Glitch
<div class="fp-cybersecurity-server-uptime-monitor-ui">
    <div class="fp-cybersecurity-server-uptime-monitor-ui-stage">
        <div class="fp-cybersecurity-server-uptime-monitor-ui-scanlines"></div>

        <div class="fp-cybersecurity-server-uptime-monitor-ui-card" id="fp-cybersecurity-server-uptime-monitor-ui-card">

            <div class="fp-cybersecurity-server-uptime-monitor-ui-header">
                <span class="fp-cybersecurity-server-uptime-monitor-ui-title">SYS_NODE: ALPHA</span>
                <div class="fp-cybersecurity-server-uptime-monitor-ui-status" id="fp-cybersecurity-server-uptime-monitor-ui-status">
                    <div class="fp-cybersecurity-server-uptime-monitor-ui-dot"></div>
                    <span id="fp-cybersecurity-server-uptime-monitor-ui-status-text">SECURE</span>
                </div>
            </div>

            <div class="fp-cybersecurity-server-uptime-monitor-ui-body">
                <div class="fp-cybersecurity-server-uptime-monitor-ui-radar-ring fp-cybersecurity-server-uptime-monitor-ui-radar-1"></div>
                <div class="fp-cybersecurity-server-uptime-monitor-ui-radar-ring fp-cybersecurity-server-uptime-monitor-ui-radar-2"></div>

                <div class="fp-cybersecurity-server-uptime-monitor-ui-core">
                    <span class="fp-cybersecurity-server-uptime-monitor-ui-core-val" id="fp-cybersecurity-server-uptime-monitor-ui-load">24%</span>
                    <span class="fp-cybersecurity-server-uptime-monitor-ui-core-lbl">CPU LOAD</span>
                </div>
            </div>

            <div class="fp-cybersecurity-server-uptime-monitor-ui-footer">
                <div class="fp-cybersecurity-server-uptime-monitor-ui-stat">
                    <span class="fp-cybersecurity-server-uptime-monitor-ui-stat-lbl">REQ/SEC</span>
                    <span class="fp-cybersecurity-server-uptime-monitor-ui-stat-val" id="fp-cybersecurity-server-uptime-monitor-ui-req">1,204</span>
                </div>
                <div class="fp-cybersecurity-server-uptime-monitor-ui-stat">
                    <span class="fp-cybersecurity-server-uptime-monitor-ui-stat-lbl">UPTIME</span>
                    <span class="fp-cybersecurity-server-uptime-monitor-ui-stat-val">99.9%</span>
                </div>
                <div class="fp-cybersecurity-server-uptime-monitor-ui-stat">
                    <span class="fp-cybersecurity-server-uptime-monitor-ui-stat-lbl">LATENCY</span>
                    <span class="fp-cybersecurity-server-uptime-monitor-ui-stat-val" id="fp-cybersecurity-server-uptime-monitor-ui-ping">12ms</span>
                </div>
            </div>
        </div>
    </div>
</div>
.fp-cybersecurity-server-uptime-monitor-ui {
--fp-container-width: 100%;
--fp-max-width: 500px;
--fp-aspect-ratio: 1 / 1;
--fp-primary-color: #ffffff;
--fp-secondary-color: #f8fafc;
--fp-muted-color: #64748b;
--fp-soft-color: #e2e8f0;
--fp-background-color: transparent;
--fp-info-color: #0f172a;
--fp-warning-color: #f59e0b;
--fp-danger-color: #991b1b;
--fp-accent-color: #dc2626;
--fp-text-color: #000000;
width: var(--fp-container-width);
max-width: var(--fp-max-width);
margin: 0 auto;
background: var(--fp-background-color);
font-family: ui-monospace, 'Cascadia Code', 'Source Code Pro', Menlo, Consolas, monospace;
box-sizing: border-box;
position: relative;
}
.fp-cybersecurity-server-uptime-monitor-ui * {
box-sizing: inherit;
}
.fp-cybersecurity-server-uptime-monitor-ui-stage {
aspect-ratio: var(--fp-aspect-ratio);
background: var(--fp-primary-color);
border-radius: 16px;
display: flex;
align-items: center;
justify-content: center;
position: relative;
overflow: hidden;
border: 1px solid var(--fp-soft-color);
box-shadow: 0 10px 30px -10px rgba(0, 0, 0, 0.1);
}
.fp-cybersecurity-server-uptime-monitor-ui-scanlines {
position: absolute;
top: 0; left: 0; right: 0; bottom: 0;
background: linear-gradient(
to bottom,
rgba(0, 0, 0, 0) 50%,
rgba(0, 0, 0, 0.02) 50%
);
background-size: 100% 4px;
z-index: 1;
pointer-events: none;
animation: fp-cybersecurity-server-uptime-monitor-ui-breathe 4s ease-in-out infinite alternate;
}
@keyframes fp-cybersecurity-server-uptime-monitor-ui-breathe {
0% { opacity: 0.3; }
100% { opacity: 0.7; }
}
.fp-cybersecurity-server-uptime-monitor-ui-card {
position: relative;
z-index: 2;
width: 85%;
height: 85%;
background: var(--fp-primary-color);
border: 2px solid var(--fp-text-color);
display: flex;
flex-direction: column;
box-shadow: 8px 8px 0px rgba(0, 0, 0, 0.05);
transition: all 0.1s ease;
}
.fp-cybersecurity-server-uptime-monitor-ui-card.is-glitching {
border-color: var(--fp-accent-color);
box-shadow:
-4px 4px 0px rgba(220, 38, 38, 0.4),
4px -4px 0px rgba(0, 255, 255, 0.3);
animation: fp-cybersecurity-server-uptime-monitor-ui-glitch-shake 0.4s cubic-bezier(0.25, 0.46, 0.45, 0.94) both;
}
@keyframes fp-cybersecurity-server-uptime-monitor-ui-glitch-shake {
0%, 100% { transform: translate(0); }
20% { transform: translate(-4px, 2px) skewX(2deg); }
40% { transform: translate(4px, -2px) skewX(-2deg); }
60% { transform: translate(-2px, -4px); }
80% { transform: translate(2px, 4px); }
}
.fp-cybersecurity-server-uptime-monitor-ui-header {
display: flex;
justify-content: space-between;
align-items: center;
padding: 12px 16px;
border-bottom: 2px solid var(--fp-text-color);
background: var(--fp-secondary-color);
}
.fp-cybersecurity-server-uptime-monitor-ui-card.is-glitching .fp-cybersecurity-server-uptime-monitor-ui-header {
background: var(--fp-accent-color);
border-bottom-color: var(--fp-accent-color);
color: var(--fp-primary-color);
}
.fp-cybersecurity-server-uptime-monitor-ui-title {
font-size: 0.8rem;
font-weight: 700;
letter-spacing: 0.1em;
color: inherit;
}
.fp-cybersecurity-server-uptime-monitor-ui-status {
display: flex;
align-items: center;
gap: 6px;
font-size: 0.7rem;
font-weight: 700;
padding: 4px 8px;
border: 1px solid var(--fp-text-color);
background: var(--fp-primary-color);
color: var(--fp-text-color);
}
.fp-cybersecurity-server-uptime-monitor-ui-card.is-glitching .fp-cybersecurity-server-uptime-monitor-ui-status {
border-color: var(--fp-primary-color);
color: var(--fp-accent-color);
}
.fp-cybersecurity-server-uptime-monitor-ui-dot {
width: 6px;
height: 6px;
background: var(--fp-text-color);
border-radius: 50%;
}
.fp-cybersecurity-server-uptime-monitor-ui-card.is-glitching .fp-cybersecurity-server-uptime-monitor-ui-dot {
background: var(--fp-accent-color);
box-shadow: 0 0 8px var(--fp-accent-color);
animation: fp-cybersecurity-server-uptime-monitor-ui-flash 0.2s infinite alternate;
}
@keyframes fp-cybersecurity-server-uptime-monitor-ui-flash {
from { opacity: 1; }
to { opacity: 0; }
}
.fp-cybersecurity-server-uptime-monitor-ui-body {
flex: 1;
position: relative;
display: flex;
align-items: center;
justify-content: center;
overflow: hidden;
background: linear-gradient(135deg, var(--fp-primary-color) 0%, var(--fp-secondary-color) 100%);
}
.fp-cybersecurity-server-uptime-monitor-ui-card.is-glitching .fp-cybersecurity-server-uptime-monitor-ui-body::after {
content: '';
position: absolute;
top: 0; left: 0; right: 0; bottom: 0;
background: repeating-linear-gradient(
0deg,
transparent,
transparent 10px,
rgba(220, 38, 38, 0.1) 10px,
rgba(220, 38, 38, 0.1) 20px
);
pointer-events: none;
z-index: 10;
}
.fp-cybersecurity-server-uptime-monitor-ui-radar-ring {
position: absolute;
border-radius: 50%;
border: 1px solid var(--fp-soft-color);
}
.fp-cybersecurity-server-uptime-monitor-ui-radar-1 {
width: 140px; height: 140px;
border: 2px dashed var(--fp-muted-color);
animation: fp-cybersecurity-server-uptime-monitor-ui-spin 15s linear infinite;
}
.fp-cybersecurity-server-uptime-monitor-ui-radar-2 {
width: 180px; height: 180px;
border-top: 2px solid var(--fp-text-color);
border-bottom: 2px solid var(--fp-text-color);
animation: fp-cybersecurity-server-uptime-monitor-ui-spin-rev 10s linear infinite;
}
.fp-cybersecurity-server-uptime-monitor-ui-card.is-glitching .fp-cybersecurity-server-uptime-monitor-ui-radar-1,
.fp-cybersecurity-server-uptime-monitor-ui-card.is-glitching .fp-cybersecurity-server-uptime-monitor-ui-radar-2 {
border-color: var(--fp-accent-color);
animation-duration: 2s;
}
@keyframes fp-cybersecurity-server-uptime-monitor-ui-spin {
0% { transform: rotate(0deg); }
100% { transform: rotate(360deg); }
}
@keyframes fp-cybersecurity-server-uptime-monitor-ui-spin-rev {
0% { transform: rotate(360deg); }
100% { transform: rotate(-360deg); }
}
.fp-cybersecurity-server-uptime-monitor-ui-core {
position: relative;
z-index: 5;
display: flex;
flex-direction: column;
align-items: center;
justify-content: center;
width: 100px;
height: 100px;
background: var(--fp-primary-color);
border: 2px solid var(--fp-text-color);
border-radius: 50%;
box-shadow: 0 4px 12px rgba(0,0,0,0.05);
}
.fp-cybersecurity-server-uptime-monitor-ui-card.is-glitching .fp-cybersecurity-server-uptime-monitor-ui-core {
border-color: var(--fp-accent-color);
background: #fff0f0;
color: var(--fp-accent-color);
box-shadow:
inset 0 0 10px rgba(220, 38, 38, 0.3),
0 0 20px rgba(220, 38, 38, 0.4);
}
.fp-cybersecurity-server-uptime-monitor-ui-core-val {
font-size: 1.75rem;
font-weight: 800;
line-height: 1;
margin-bottom: 4px;
}
.fp-cybersecurity-server-uptime-monitor-ui-core-lbl {
font-size: 0.5rem;
font-weight: 700;
color: var(--fp-muted-color);
letter-spacing: 0.1em;
}
.fp-cybersecurity-server-uptime-monitor-ui-card.is-glitching .fp-cybersecurity-server-uptime-monitor-ui-core-val {
text-shadow: 2px 0 var(--fp-accent-color), -2px 0 #0ff;
animation: fp-cybersecurity-server-uptime-monitor-ui-text-glitch 0.2s infinite;
}
@keyframes fp-cybersecurity-server-uptime-monitor-ui-text-glitch {
0% { transform: translate(0); }
25% { transform: translate(-1px, 1px); }
50% { transform: translate(1px, -1px); }
75% { transform: translate(-1px, -1px); }
100% { transform: translate(1px, 1px); }
}
.fp-cybersecurity-server-uptime-monitor-ui-footer {
display: grid;
grid-template-columns: 1fr 1fr 1fr;
border-top: 2px solid var(--fp-text-color);
background: var(--fp-primary-color);
}
.fp-cybersecurity-server-uptime-monitor-ui-card.is-glitching .fp-cybersecurity-server-uptime-monitor-ui-footer {
border-top-color: var(--fp-accent-color);
}
.fp-cybersecurity-server-uptime-monitor-ui-stat {
padding: 12px 8px;
display: flex;
flex-direction: column;
align-items: center;
border-right: 2px solid var(--fp-text-color);
}
.fp-cybersecurity-server-uptime-monitor-ui-card.is-glitching .fp-cybersecurity-server-uptime-monitor-ui-stat {
border-right-color: var(--fp-accent-color);
}
.fp-cybersecurity-server-uptime-monitor-ui-stat:last-child {
border-right: none;
}
.fp-cybersecurity-server-uptime-monitor-ui-stat-lbl {
font-size: 0.55rem;
color: var(--fp-muted-color);
font-weight: 700;
margin-bottom: 4px;
}
.fp-cybersecurity-server-uptime-monitor-ui-stat-val {
font-size: 0.9rem;
font-weight: 700;
color: var(--fp-info-color);
font-variant-numeric: tabular-nums;
}
.fp-cybersecurity-server-uptime-monitor-ui-card.is-glitching .fp-cybersecurity-server-uptime-monitor-ui-stat-val {
color: var(--fp-accent-color);
}
@media (max-width: 480px) {
.fp-cybersecurity-server-uptime-monitor-ui-card { width: 90%; height: 90%; }
.fp-cybersecurity-server-uptime-monitor-ui-core { width: 80px; height: 80px; }
.fp-cybersecurity-server-uptime-monitor-ui-core-val { font-size: 1.4rem; }
.fp-cybersecurity-server-uptime-monitor-ui-radar-1 { width: 110px; height: 110px; }
.fp-cybersecurity-server-uptime-monitor-ui-radar-2 { width: 140px; height: 140px; }
.fp-cybersecurity-server-uptime-monitor-ui-stat { padding: 8px 4px; }
.fp-cybersecurity-server-uptime-monitor-ui-stat-val { font-size: 0.75rem; }
}(function() {
document.querySelectorAll('.fp-cybersecurity-server-uptime-monitor-ui').forEach(root => {
const card = root.querySelector('#fp-cybersecurity-server-uptime-monitor-ui-card');
const loadEl = root.querySelector('#fp-cybersecurity-server-uptime-monitor-ui-load');
const reqEl = root.querySelector('#fp-cybersecurity-server-uptime-monitor-ui-req');
const pingEl = root.querySelector('#fp-cybersecurity-server-uptime-monitor-ui-ping');
const statusText = root.querySelector('#fp-cybersecurity-server-uptime-monitor-ui-status-text');
if (!card || !loadEl || !reqEl || !pingEl || !statusText) return;
let animationFrameId;
let lastEventTime = 0;
let tickTime = 0;
let isGlitching = false;
let currentLoad = 24;
let currentReq = 1204;
let currentPing = 12;
function fp_cybersecurity_server_uptime_monitor_ui_loop(timestamp) {
if (!document.body.contains(root)) {
cancelAnimationFrame(animationFrameId);
observer.disconnect();
document.removeEventListener('visibilitychange', fp_cybersecurity_server_uptime_monitor_ui_handleVisibilityChange);
return;
}
if (document.visibilityState === 'visible') {
if (timestamp - lastEventTime > (4000 + Math.random() * 4000)) {
lastEventTime = timestamp;
isGlitching = true;
card.classList.add('is-glitching');
statusText.textContent = "ANOMALY";
setTimeout(() => {
if(document.body.contains(root)) {
card.classList.remove('is-glitching');
statusText.textContent = "SECURE";
isGlitching = false;
}
}, 600 + Math.random() * 600);
}
if (timestamp - tickTime > 100) {
tickTime = timestamp;
if (isGlitching) {
currentLoad = Math.floor(85 + Math.random() * 14);
currentReq = Math.floor(8000 + Math.random() * 4000);
currentPing = Math.floor(150 + Math.random() * 200);
} else {
currentLoad = Math.floor(20 + Math.random() * 10);
currentReq = Math.floor(1100 + Math.random() * 300);
currentPing = Math.floor(10 + Math.random() * 5);
}
loadEl.textContent = currentLoad + "%";
reqEl.textContent = currentReq.toLocaleString('en-US');
pingEl.textContent = currentPing + "ms";
}
}
animationFrameId = requestAnimationFrame(fp_cybersecurity_server_uptime_monitor_ui_loop);
}
function fp_cybersecurity_server_uptime_monitor_ui_handleVisibilityChange() {
if (document.visibilityState === 'hidden') {
if (animationFrameId) {
cancelAnimationFrame(animationFrameId);
animationFrameId = null;
}
} else {
if (!animationFrameId) {
lastEventTime = performance.now();
tickTime = performance.now();
animationFrameId = requestAnimationFrame(fp_cybersecurity_server_uptime_monitor_ui_loop);
}
}
}
document.addEventListener('visibilitychange', fp_cybersecurity_server_uptime_monitor_ui_handleVisibilityChange);
const observer = new IntersectionObserver((entries) => {
entries.forEach(entry => {
if (entry.isIntersecting) {
if (!animationFrameId && document.visibilityState === 'visible') {
lastEventTime = performance.now();
tickTime = performance.now();
animationFrameId = requestAnimationFrame(fp_cybersecurity_server_uptime_monitor_ui_loop);
}
} else {
if (animationFrameId) {
cancelAnimationFrame(animationFrameId);
animationFrameId = null;
}
}
});
}, { threshold: 0.1 });
observer.observe(root);
});
})();Description
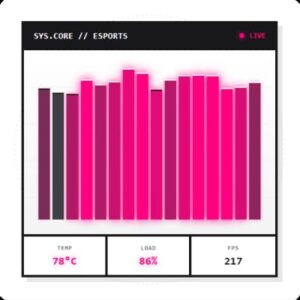
The CyberSec Server Vitals card is a high-performance UI component from our Crimson Glitch collection. Engineered for the demanding cybersecurity sector, this asset allows developers to display real time server metrics, threat levels, and system health with a distinctive aesthetic. It provides a drop-in solution for teams that need high-impact visuals without the technical debt of external dependencies.
Monitoring interfaces in security operations centers require absolute reliability and speed. Many current UI libraries introduce unnecessary bloat that can lag during critical data spikes. This component solves that problem by using a sterile code structure. It ensures your monitoring dashboard remains lightweight and responsive, allowing security analysts to focus on the data rather than waiting for heavy interface scripts to load.
Technical Architecture & Performance
-
Zero-Dependency Core: Built entirely with native HTML, CSS, and Vanilla JavaScript. There is no reliance on Tailwind, Bootstrap, or GSAP.
-
Sterile DOM Structure: The markup is lean and semantic. This minimizes the browser work required for layout calculations and paint cycles.
-
PageSpeed Optimization: Every line of code is tuned for Core Web Vitals. You can expect a 90+ score on mobile and desktop performance audits.
-
Pure CSS Scoping: All styles are encapsulated to prevent CSS leakage. This makes it safe to integrate into large scale enterprise applications without breaking global styles.
-
Efficient Animation: The glitch effects are handled through optimized CSS keyframes. This keeps the main thread clear for data processing and logic.
Design & Aesthetic Impact
The visual identity of this component is defined by the Crimson Action color palette. It uses deep reds and high-contrast accents to signal urgency and authority. The primary design feature is a sophisticated glitch and signal distortion animation. When a user hovers over the card or when a threshold is met, the UI mimics a digital signal interruption. This effect perfectly captures the high-stakes environment of cybersecurity. The UI remains clean and professional, ensuring that even with the distortion effects, the server data stays legible and actionable for the user.
Enterprise Use Cases
-
SOC Dashboards: Use these cards to display the real time status of global server nodes. The glitch animation can trigger when a potential intrusion is detected, providing an immediate visual cue to the security team.
-
Security SaaS Platforms: Integrate the component into the user dashboard of a cybersecurity software product. It serves as a premium way to show system health or active firewall activity to B2B clients.
-
Threat Intelligence Reports: Implement the cards as interactive headers for live threat feeds. The fast-loading code ensures that analysts can access critical data quickly without the UI slowing down their investigation.
Highlights & Benefits
Drop the code straight into your project without configuration.
Built strictly with pure CSS & Vanilla JS for maximum speed.
Constructed with strict adherence to WCAG accessibility standards for perfect contrast and screen-reader support.
Utilizes a highly optimized, clean DOM architecture ensuring lightning-fast render and maximum PageSpeed scores.

CyberSec Server Vitals – Crimson Glitch
Description
The CyberSec Server Vitals card is a high-performance UI component from our Crimson Glitch collection. Engineered for the demanding cybersecurity sector, this asset allows developers to display real time server metrics, threat levels, and system health with a distinctive aesthetic. It provides a drop-in solution for teams that need high-impact visuals without the technical debt of external dependencies.
Monitoring interfaces in security operations centers require absolute reliability and speed. Many current UI libraries introduce unnecessary bloat that can lag during critical data spikes. This component solves that problem by using a sterile code structure. It ensures your monitoring dashboard remains lightweight and responsive, allowing security analysts to focus on the data rather than waiting for heavy interface scripts to load.
Technical Architecture & Performance
-
Zero-Dependency Core: Built entirely with native HTML, CSS, and Vanilla JavaScript. There is no reliance on Tailwind, Bootstrap, or GSAP.
-
Sterile DOM Structure: The markup is lean and semantic. This minimizes the browser work required for layout calculations and paint cycles.
-
PageSpeed Optimization: Every line of code is tuned for Core Web Vitals. You can expect a 90+ score on mobile and desktop performance audits.
-
Pure CSS Scoping: All styles are encapsulated to prevent CSS leakage. This makes it safe to integrate into large scale enterprise applications without breaking global styles.
-
Efficient Animation: The glitch effects are handled through optimized CSS keyframes. This keeps the main thread clear for data processing and logic.
Design & Aesthetic Impact
The visual identity of this component is defined by the Crimson Action color palette. It uses deep reds and high-contrast accents to signal urgency and authority. The primary design feature is a sophisticated glitch and signal distortion animation. When a user hovers over the card or when a threshold is met, the UI mimics a digital signal interruption. This effect perfectly captures the high-stakes environment of cybersecurity. The UI remains clean and professional, ensuring that even with the distortion effects, the server data stays legible and actionable for the user.
Enterprise Use Cases
-
SOC Dashboards: Use these cards to display the real time status of global server nodes. The glitch animation can trigger when a potential intrusion is detected, providing an immediate visual cue to the security team.
-
Security SaaS Platforms: Integrate the component into the user dashboard of a cybersecurity software product. It serves as a premium way to show system health or active firewall activity to B2B clients.
-
Threat Intelligence Reports: Implement the cards as interactive headers for live threat feeds. The fast-loading code ensures that analysts can access critical data quickly without the UI slowing down their investigation.