GreenTech Climate Card – Pine Organic
Source Code Locked
Get the appropriate Subscription to unlock all copy-paste ready components instantly.
Description
Meet the GreenTech Climate Card from our Pine Organic series. This is a premium, free to use UI card component built specifically for modern clean energy and environmental data platforms. It gives development teams a ready to deploy solution for displaying live climate metrics and power grid telemetry without adding bloated markup to the codebase.
Building high frequency data dashboards for renewable energy monitoring often leads to sluggish UI interactions when relying on heavy front end frameworks. This asset solves that exact issue for the GreenTech sector. By using a sterile DOM structure and dropping external libraries entirely, developers get a highly responsive interface. This ensures the application maintains strict performance budgets during live sensor syncs and passes rigorous enterprise audits.
Technical Architecture & Performance
-
Pure Code Stack: Built entirely with vanilla JavaScript, HTML5, and CSS3. There are absolutely no external dependencies to clash with your current architecture.
-
Zero Framework Bloat: We intentionally bypassed utility class frameworks like Tailwind or Bootstrap and heavy animation scripts like GSAP to keep the payload as light as possible.
-
Performance First: The sterile DOM and lean CSS guarantee rapid render times. This component consistently hits 90+ scores on Core Web Vitals.
-
Scoped Styling: All CSS is cleanly scoped to prevent style leakage. This guarantees a predictable and conflict free integration into legacy or modern enterprise setups.
Design & Aesthetic Impact
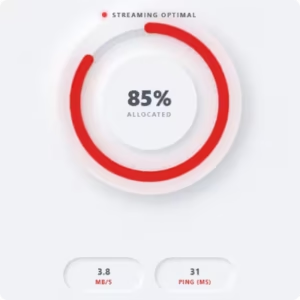
The visual layout focuses on a crisp and modern aesthetic tailored for data heavy environmental applications. The Pine Corporate color tones establish clear visual hierarchies. This draws user attention to critical sustainability metrics and system alerts without overwhelming the screen. The core interaction features a custom sine wave oscillation animation. This smooth mathematical motion design provides immediate visual feedback to represent live energy grids or fluctuating carbon emission data. The result is a highly polished and intuitive user experience that feels native to premium corporate dashboards.
Enterprise Use Cases
-
Solar Farm Dashboards: Integrate these cards into large format control center displays. Grid operators can view a continuous oscillation of live battery storage levels and solar array outputs without refreshing the view.
-
Corporate ESG Reporting Portals: Equip sustainability managers with a lightweight dashboard to track daily carbon offset metrics. The pure code cards handle fast data syncing without slowing down the initial page load.
-
Smart Grid Analytics: Use the component inside aggregate energy monitoring tools. Plant engineers get a highly responsive UI that highlights real time power fluctuations from wind and hydroelectric sources.
Highlights & Benefits
Drop the code straight into your project without configuration.
Built strictly with pure CSS & Vanilla JS for maximum speed.
Constructed with strict adherence to WCAG accessibility standards for perfect contrast and screen-reader support.
Utilizes a highly optimized, clean DOM architecture ensuring lightning-fast render and maximum PageSpeed scores.

GreenTech Climate Card – Pine Organic
Description
Meet the GreenTech Climate Card from our Pine Organic series. This is a premium, free to use UI card component built specifically for modern clean energy and environmental data platforms. It gives development teams a ready to deploy solution for displaying live climate metrics and power grid telemetry without adding bloated markup to the codebase.
Building high frequency data dashboards for renewable energy monitoring often leads to sluggish UI interactions when relying on heavy front end frameworks. This asset solves that exact issue for the GreenTech sector. By using a sterile DOM structure and dropping external libraries entirely, developers get a highly responsive interface. This ensures the application maintains strict performance budgets during live sensor syncs and passes rigorous enterprise audits.
Technical Architecture & Performance
-
Pure Code Stack: Built entirely with vanilla JavaScript, HTML5, and CSS3. There are absolutely no external dependencies to clash with your current architecture.
-
Zero Framework Bloat: We intentionally bypassed utility class frameworks like Tailwind or Bootstrap and heavy animation scripts like GSAP to keep the payload as light as possible.
-
Performance First: The sterile DOM and lean CSS guarantee rapid render times. This component consistently hits 90+ scores on Core Web Vitals.
-
Scoped Styling: All CSS is cleanly scoped to prevent style leakage. This guarantees a predictable and conflict free integration into legacy or modern enterprise setups.
Design & Aesthetic Impact
The visual layout focuses on a crisp and modern aesthetic tailored for data heavy environmental applications. The Pine Corporate color tones establish clear visual hierarchies. This draws user attention to critical sustainability metrics and system alerts without overwhelming the screen. The core interaction features a custom sine wave oscillation animation. This smooth mathematical motion design provides immediate visual feedback to represent live energy grids or fluctuating carbon emission data. The result is a highly polished and intuitive user experience that feels native to premium corporate dashboards.
Enterprise Use Cases
-
Solar Farm Dashboards: Integrate these cards into large format control center displays. Grid operators can view a continuous oscillation of live battery storage levels and solar array outputs without refreshing the view.
-
Corporate ESG Reporting Portals: Equip sustainability managers with a lightweight dashboard to track daily carbon offset metrics. The pure code cards handle fast data syncing without slowing down the initial page load.
-
Smart Grid Analytics: Use the component inside aggregate energy monitoring tools. Plant engineers get a highly responsive UI that highlights real time power fluctuations from wind and hydroelectric sources.